Design description
For this project the identification system was designed and adapted a system to sort the balls using a mixture of sensors and electromechanical components. The system uses a load cell, color sensor, and mechanical compression system to determine ball type through weight, color, and if applicable compression tests. The system outputs the ball information on a computer display and awaits a new ball to be inserted.
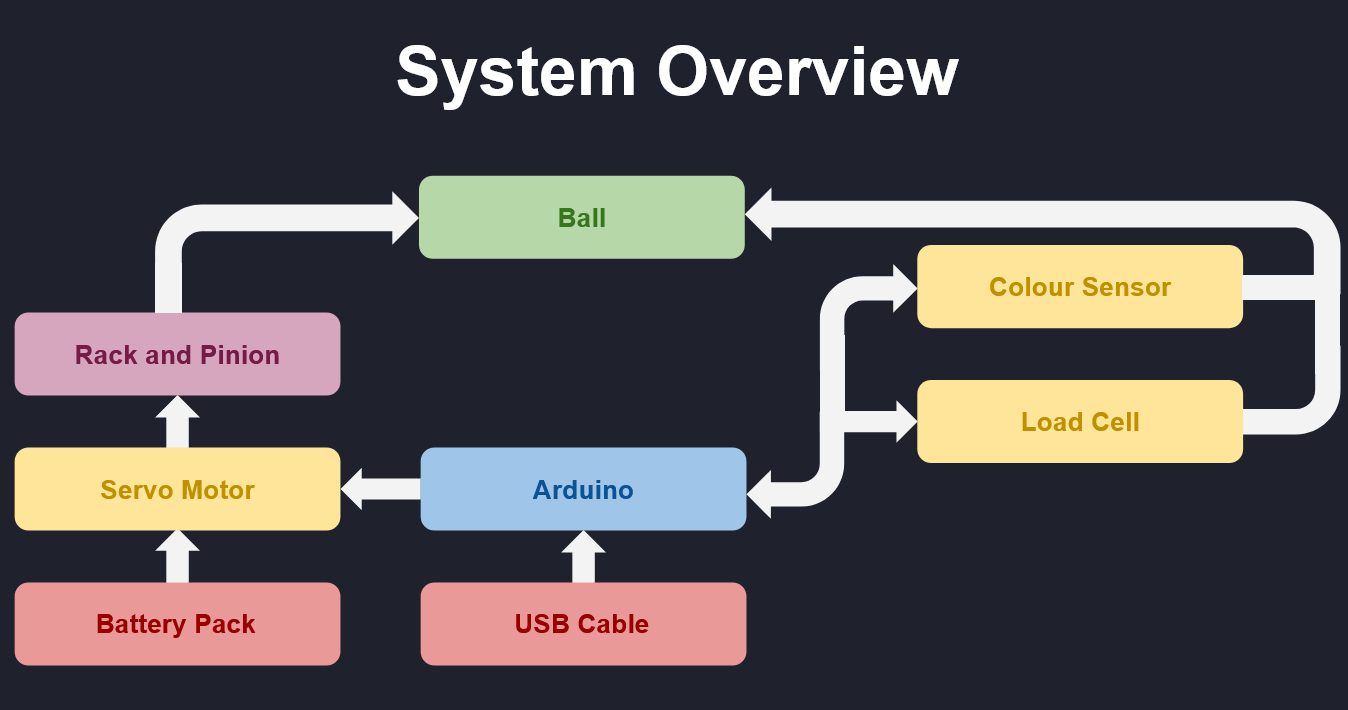
Systems overview
These process charts describe the system construction, and sub system operation.
Compression demonstration
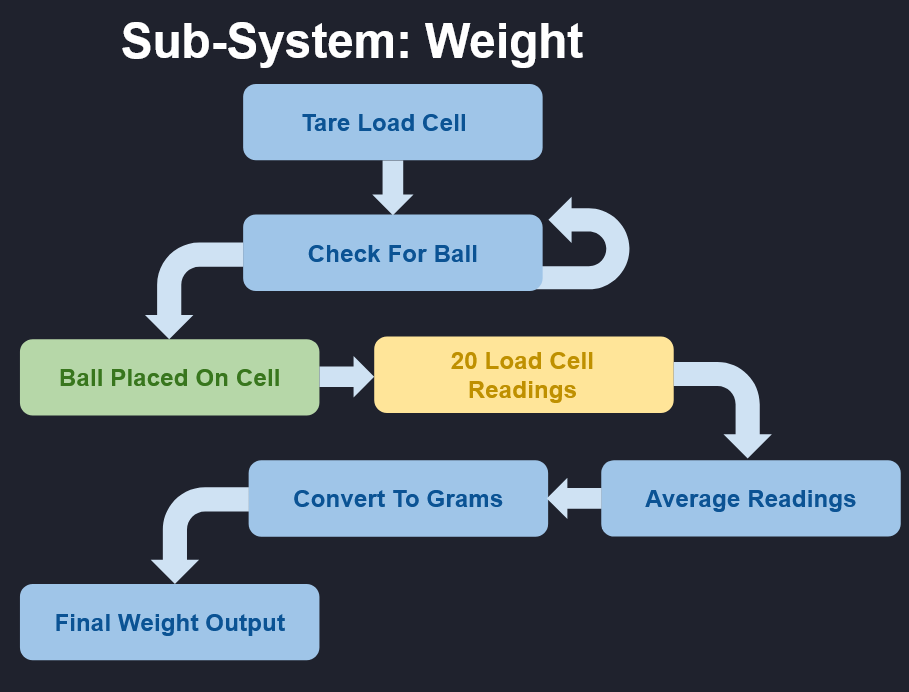
WEIGHT TEST
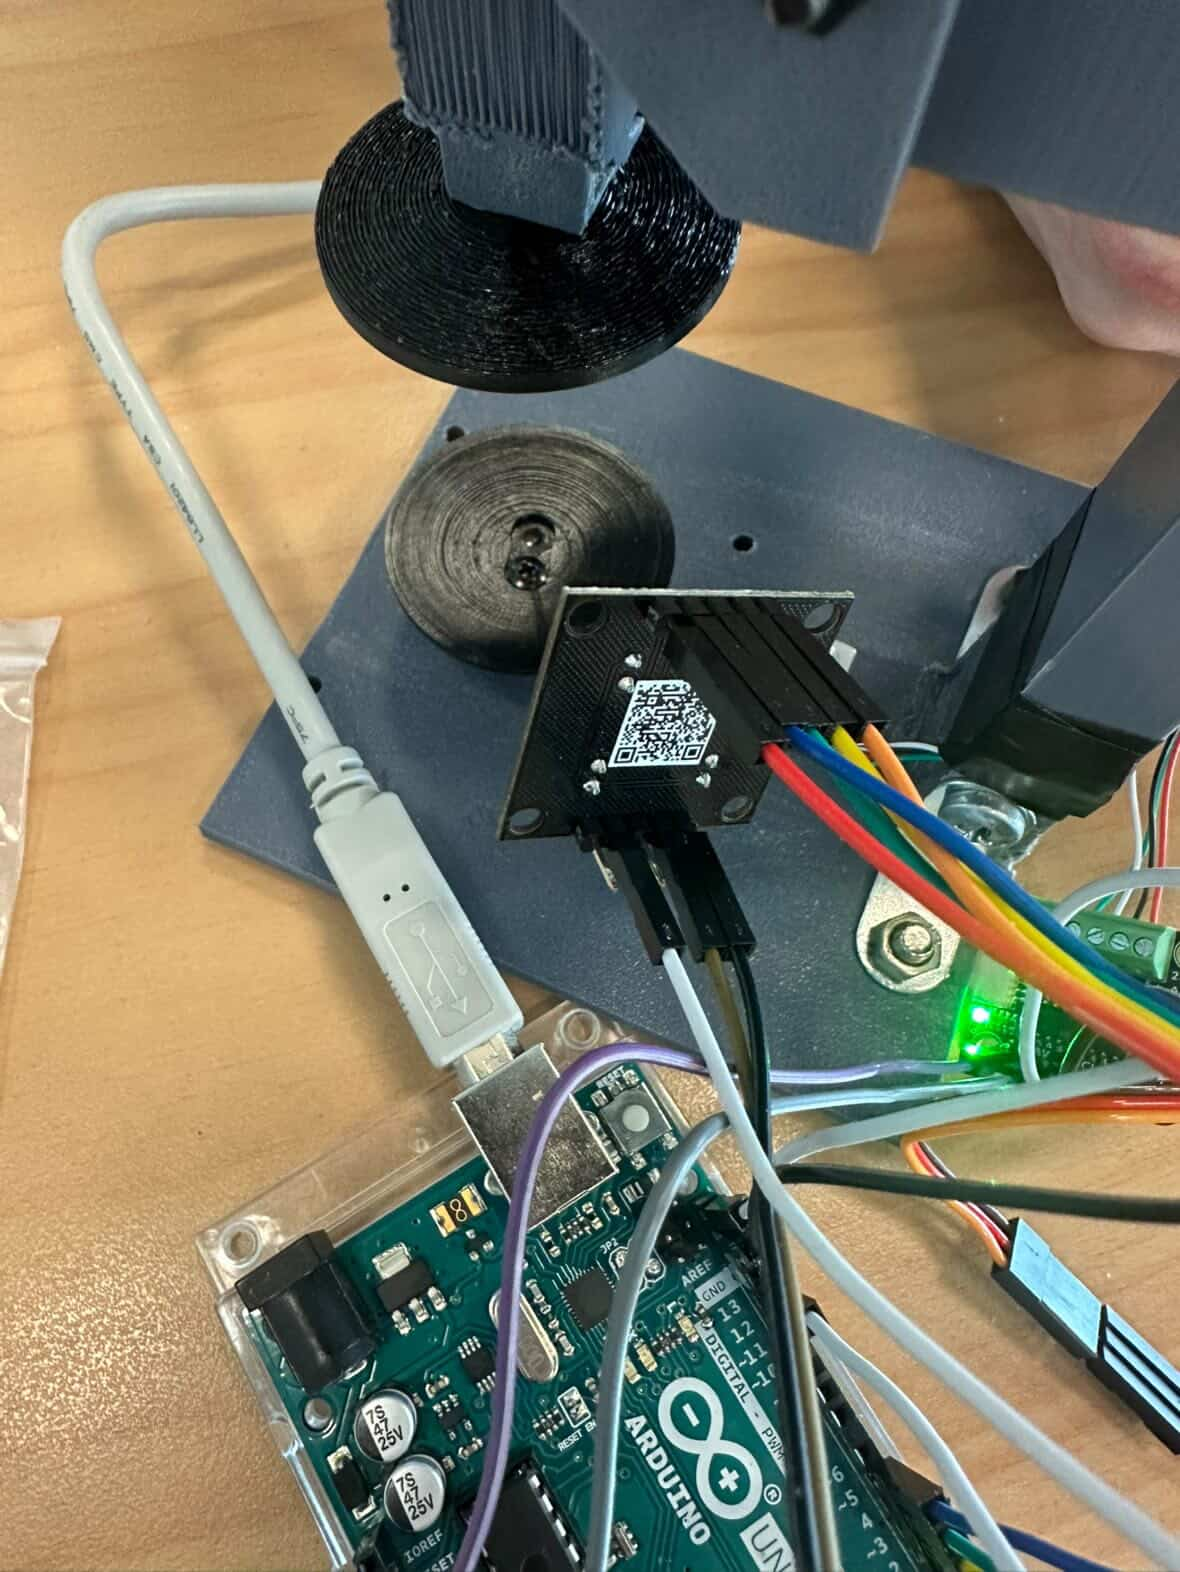
The primary test conducted by the system is to weigh and differentiate the balls into sub groups. A 500g load cell proved to be the best method for this task as it has incredible accuracy and can be used in the compression test due to the higher force limit over lower capacity cells (e.g 100g). A small ‘cup’ style catchment as shown in figure 1 was used to hold the ball in place to stop any rolling or slip during weighing and compression test. The load cell is connected to a 24 bit ADC (HX711) that provides a 20Hz reading, to calculate weight we took a mean average of 20 samples giving a figure every second. This output is arbitrary so we measured values at known weights, then standardised it by dividing the measured signal by 3150 to receive an averaged gram output. To make sure the weight is only measured when a ball is placed, a bias of 1-2g should be present on the load cell in order for it to begin logging weight.

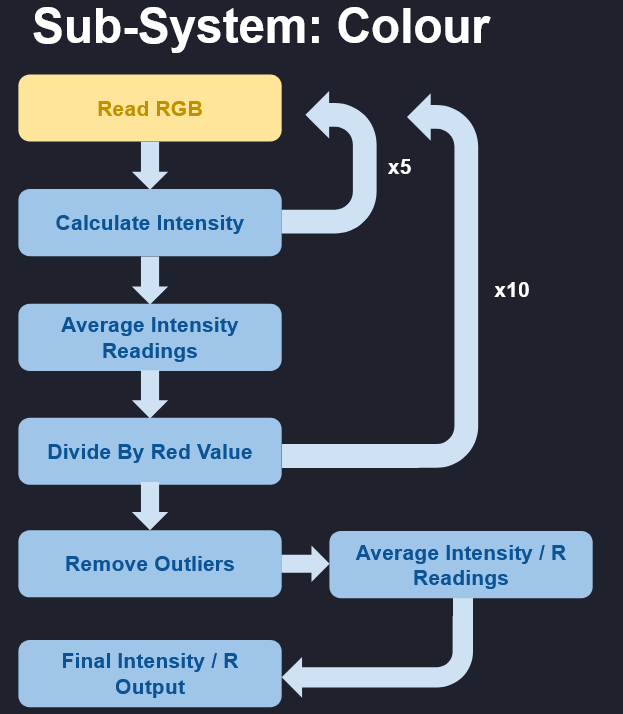
COLOR TEST
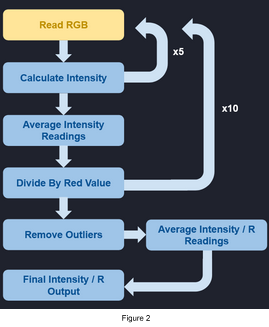
The secondary test performed by the system is to check the present ball’s color using a TCS3200. The sensor includes an integrated illumination module, allowing the system to operate in dark conditions. After the ball has been weighed, the color sensor reads the individual RGB components three times each to average the color components. This color sampling is then repeated five times to obtain an averaged intensity, calculated as the squared sum of the RGB components.The summed intensity is divided by the average red component, stored in an array, and added to a running mean. Each intensity/red value is compared to its neighbors and the mean. If a value exceeds the set threshold of 1000, it is ignored in the new calculated sum; this accounts for the usual presence of a single outlier per sample set. Finally, the resulting value is compared to known intensity/red ratios to determine the ball color. After determining the ball’s color and weight, the system can identify its type, excluding squash yellow and squash blue for these require compression to differentiate. Division by red is used because ball colors deviate the most in this component. See figure 2 for a visual representation of the process.
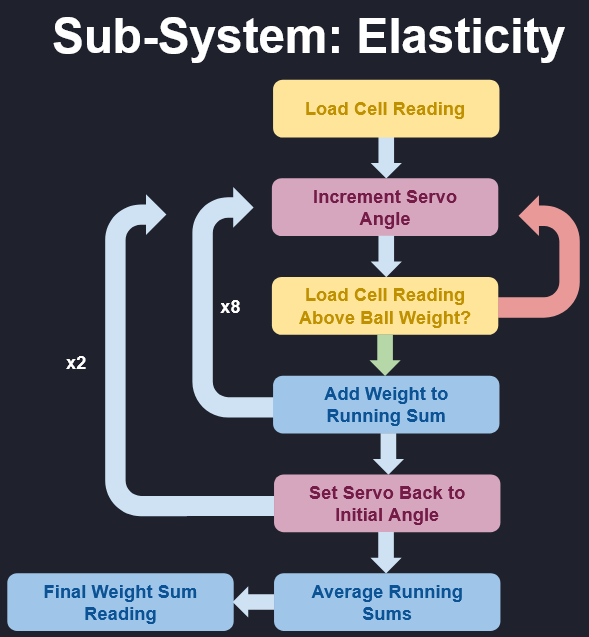
COMPRESSION TEST
The final test performed by the system is to discern the ball’s relative elasticity using a position driven rack and pinion to compress the ball. Because these squash ball’s weights overlap between sample sets, the compression test is used to distinguish them. A 3001HB positional servo is used to drive the pinion gear as this servo does not need a rotary encoder or limit switches. The servo drives a 46mm 24 tooth pinion gear. This pinion gear extends/retracts a 13 tooth rack above the load cell as seen in figure 3.